
Understanding AWS ALB 502 and 504 Errors - A practical analysis
Dec 18, 2025AWS Application Load Balancer (ALB) is a very popular service used by 100s and 1000s of AWS customers to load balance and optimize HTTP and HTTPs traffic to their application. It works at Layer 7 of the OSI model which means it fully understands the HTTP traffic which is passing through it.
In this article I will deep dive on why the ALB generates the infamous HTTP 502 or 504 errors which are very common issues for a lot of AWS customers. The ALB can generate other HTTP errors too which can be found in the AWS documentation. A common misconception is that since the ALB generated these errors there must be something wrong with the load balancer. Most the times that is not the case. On the contrary the ALB in general generates these errors when it is not able to proxy the client request to the target or when it receives an unexpected response from a target thus indicating something is wrong with the target hardware/OS/application. Lets get into the reasons why this could happen, how to diagnose and common fixes.
Who generated the error??
First thing to understand is who generated the 502/504 error? Was it the ALB or was it the backend target?
Use the Developer Tools/Curl or CloudWatch metrics/ALB Access Logs to determine this:
In this curl output you can see that the Server response header is set to Apache/2.4.58 (Ubuntu) and from this we can conclude that this error was generated by the target and not the ALB.
$ curl -v alb-demo-1974023788.ap-southeast-2.elb.amazonaws.com
* Host alb-demo-1974023788.ap-southeast-2.elb.amazonaws.com:80 was resolved.
* IPv6: (none)
* IPv4: 3.24.87.213, 13.55.172.192
*   Trying 3.24.87.213:80...
* Connected to alb-demo-1974023788.ap-southeast-2.elb.amazonaws.com (3.24.87.213) port 80
* using HTTP/1.x
> GET / HTTP/1.1
> Host: alb-demo-1974023788.ap-southeast-2.elb.amazonaws.com
> User-Agent: curl/8.11.1
> Accept: */*
>
* Request completely sent off
< HTTP/1.1 504 Gateway Timeout
< Date: Thu, 11 Dec 2025 13:28:14 GMT
< Content-Type: text/html; charset=iso-8859-1
< Content-Length: 365
< Connection: keep-alive
< Server: Apache/2.4.58 (Ubuntu) <--- Response came from the target behind ALB
Sample ALB Access Log: Both elb_status_code and target_status_code is 504 signifying that the target generated the error and the ALB simply relayed it.
http 2025-12-11T13:28:14.162359Z app/alb-demo/1fa8b17e4c17e7c7 13.211.35.216:46882 172.31.6.52:80 0.001 0.001 0.000 504 504 116 556 "GET http://alb-demo-1974023788.ap-southeast-2.elb.amazonaws.com:80/ HTTP/1.1" "curl/8.11.1" - - arn:aws:elasticloadbalancing:ap-southeast-2:592752082067:targetgroup/alb-demo/e1419229e570d841 "Root=1-693ac6ee-3bda59cb0f9d3c69591e8c87" "-" "-" 0 2025-12-11T13:28:14.159000Z "forward" "-" "-" "172.31.6.52:80" "504" "-" "-" TID_1cda3a622035454996cd2c4a60867901 "-" "-" "-"
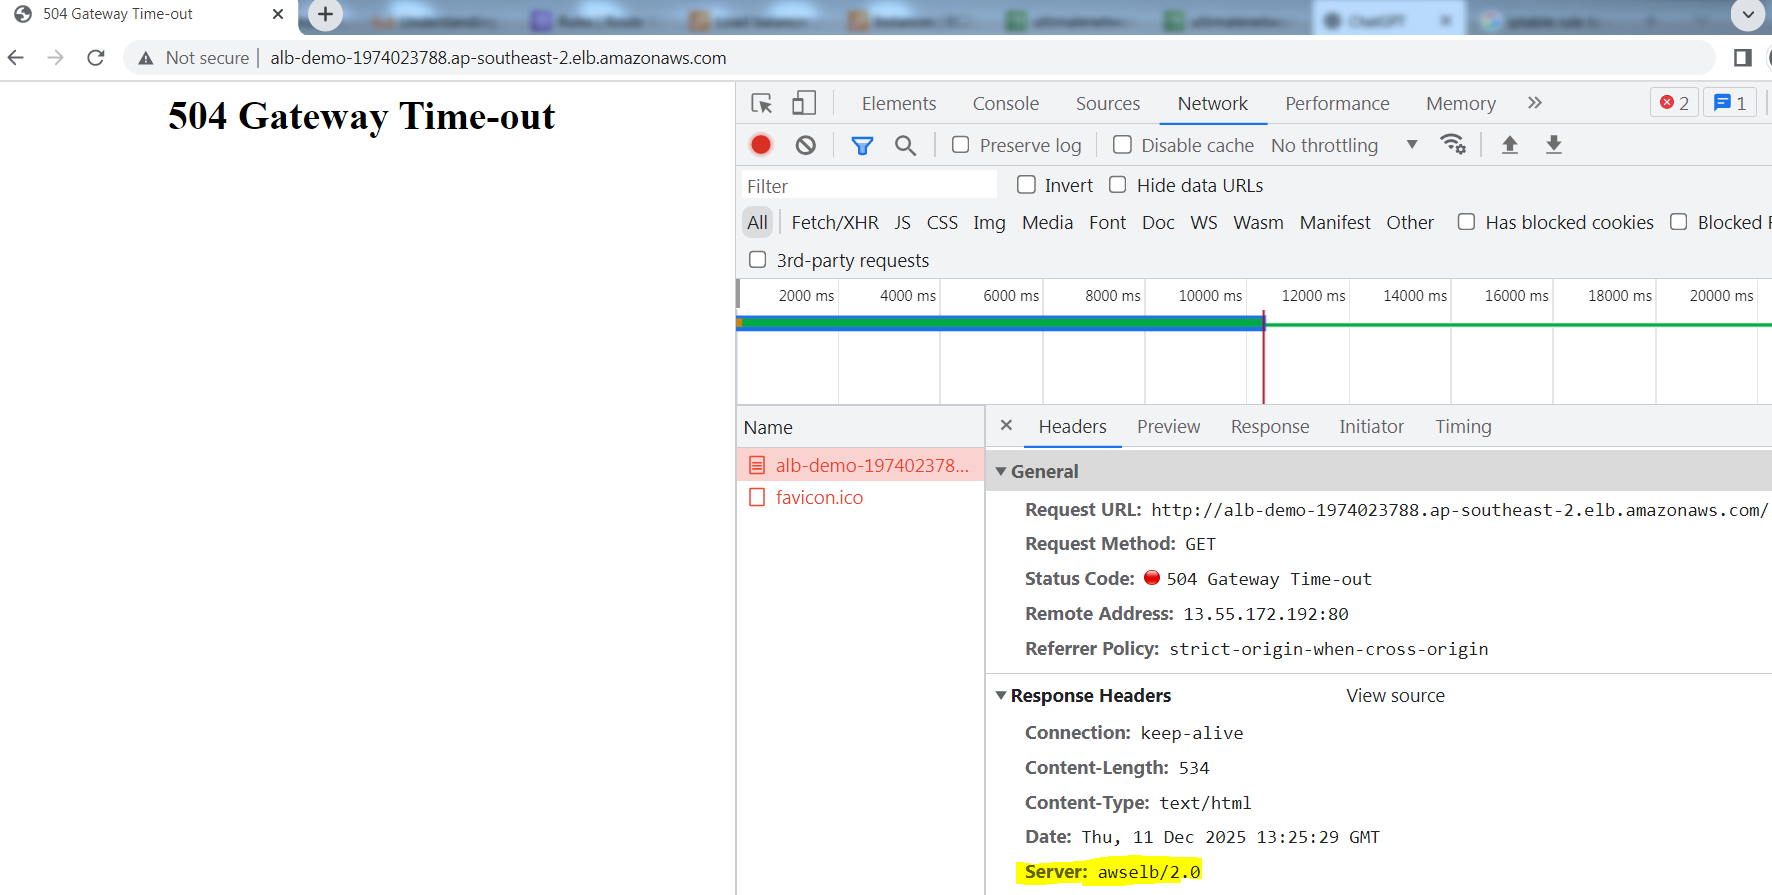
In this next example I am using Chrome Developer Tools to take a look at the HTTP headers. In this example we can see that the Server header in the response is set to awselb/2.0. This is the official value set by AWS ALB and so from this we can conclude that this 504 error was generated by the ALB.
Sample Access Log: The elb_status_code is 504 and target_status_code is -
http 2025-12-11T13:25:29.260298Z app/alb-demo/1fa8b17e4c17e7c7 49.47.11.159:64058 172.31.6.52:80 -1 -1 -1 504 - 493 694 "GET http://alb-demo-1974023788.ap-southeast-2.elb.amazonaws.com:80/ HTTP/1.1" "Mozilla/5.0 (Windows NT 10.0; Win64; x64) AppleWebKit/537.36 (KHTML, like Gecko) Chrome/109.0.0.0 Safari/537.36" - - arn:aws:elasticloadbalancing:ap-southeast-2:592752082067:targetgroup/alb-demo/e1419229e570d841 "Root=1-693ac63f-3f64318a72204f902374768c" "-" "-" 0 2025-12-11T13:25:19.259000Z "forward" "-" "-" "172.31.6.52:80" "-" "-" "-" TID_6d4d2ee3c4ccf64da4478d7b7ba08093 "-" "-" "-"
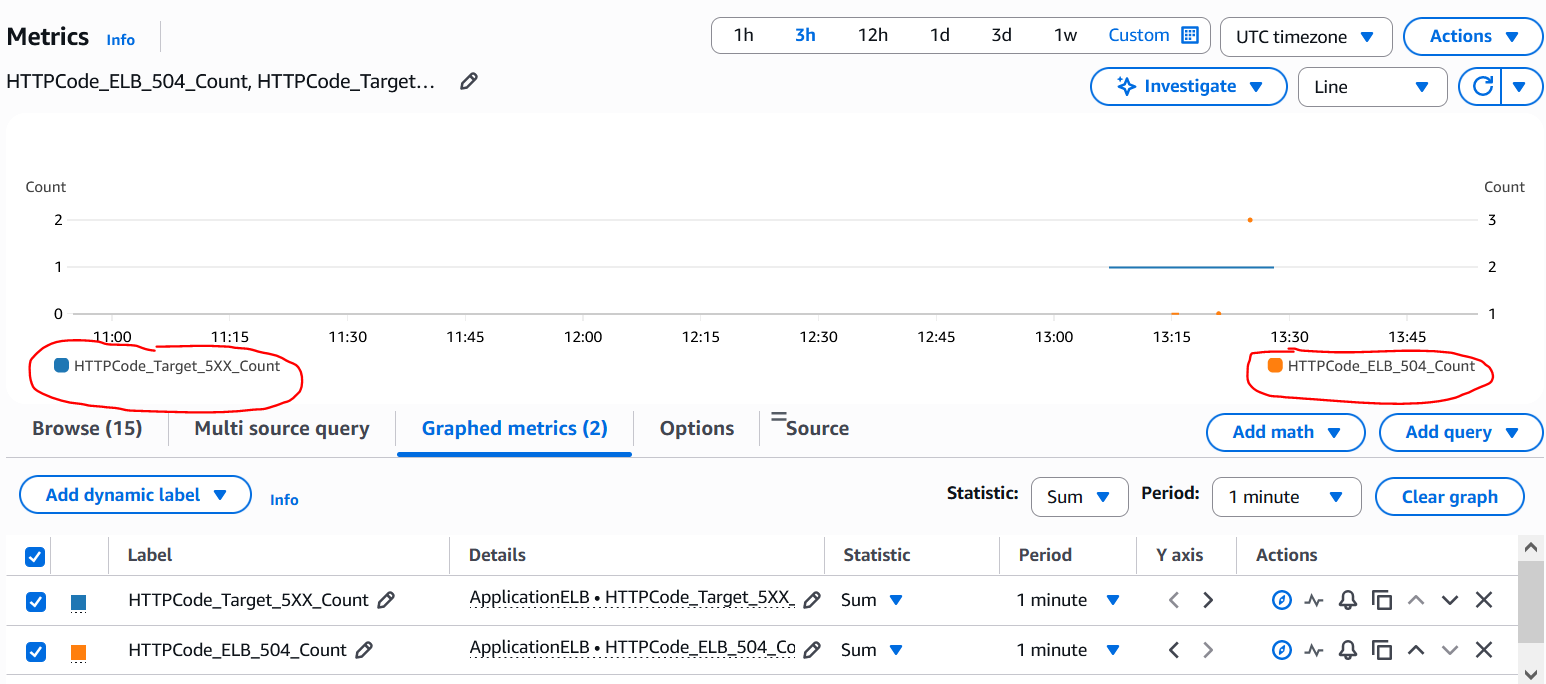
CloudWatch screenshots showing the 2 distinct metrics: There are data points for both HTTPCode_Target_5XX_Count and HTTPCode_ELB_504_Count metrics. In case of ALB generated ones it is more granular down to the individual error code while in case of target generated ones all 5xx errors are clumped under the same HTTPCode_Target_5XX_Count metric and hence we need to reply on Access Logs or other means to determine the actual HTTP error code.
If the backend target generated the error, the ALB simply passes this to the client. The application team then needs to check the application logs on the target to determine what happened. 502 and 504 HTTP errors in general indicate that the machine which generated the error tried to act like a proxy and tried to send the request to an upstream service - could be an Authentication server, another application server, a database server etc. and did not receive any response or received a bad response. This is true for Apache, Nginx and other web/application servers as well. So if the backend target generated these errors then the troubleshooting needs to focus on the connectivity between the target and the upstream service. This is not the agenda for this article though.
Similarly the ALB is also at the end of the day an HTTP proxy device and hence it generates these errors if it is not able to connect to the targets or receives a bad response from the targets. Lets dive into the reasons why ALB generates these errors.
IPs used in the below labs:
Client: 13.239.55.8213.239.55.8213.239.55.8213.239.55.82
ALB IPs: 13.55.172.192 (Internal IP: 172.31.1.158), 52.63.142.248 (Internal IP: 172.31.12.11)
Targets: 172.31.6.52, 172.31.43.235
502 Errors (Cloudwatch: HTTPCode_ELB_502_Count) :
The above mentioned AWS documentation lists down all of the reasons why ALB can generate this error - Here is a practical analysis on the most common of those reasons:
1. The ALB received a TCP RST when trying to establish a TCP connection with one of the targets:
# curl -v alb-demo-1974023788.ap-southeast-2.elb.amazonaws.com* Host alb-demo-1974023788.ap-southeast-2.elb.amazonaws.com:80 was resolved.* IPv6: (none)* IPv4: 13.55.172.192, 3.24.87.213* Trying 13.55.172.192:80...* Connected to alb-demo-1974023788.ap-southeast-2.elb.amazonaws.com (13.55.172.192) port 80* using HTTP/1.x> GET / HTTP/1.1> Host: alb-demo-1974023788.ap-southeast-2.elb.amazonaws.com> User-Agent: curl/8.11.1> Accept: */*>* Request completely sent off< HTTP/1.1 502 Bad Gateway< Server: awselb/2.0< Date: Thu, 11 Dec 2025 16:42:57 GMT< Content-Type: text/html< Content-Length: 122< Connection: keep-alive<
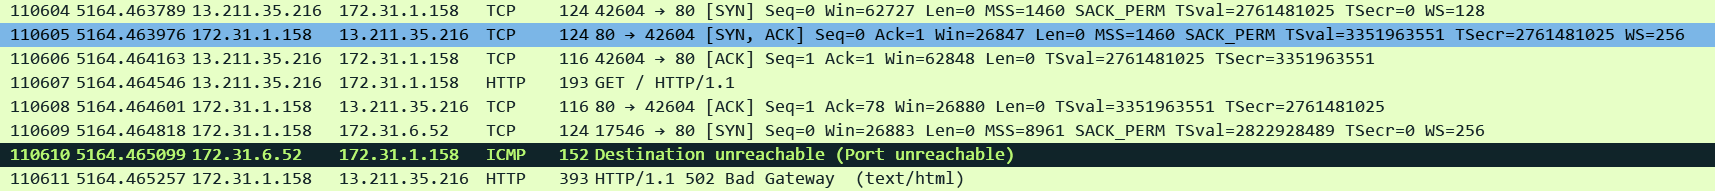
This is how it looks like on pcap. I used AWS VPC Traffic Mirroring feature to capture traffic on the ENIs created by the ALB so its easy to see the front-end (client side) and the back-end (server side) connections together. We can see the client side connection coming in and then ALB trying to establish a connection to one of the targets and receiving a TCP RST straightaway.
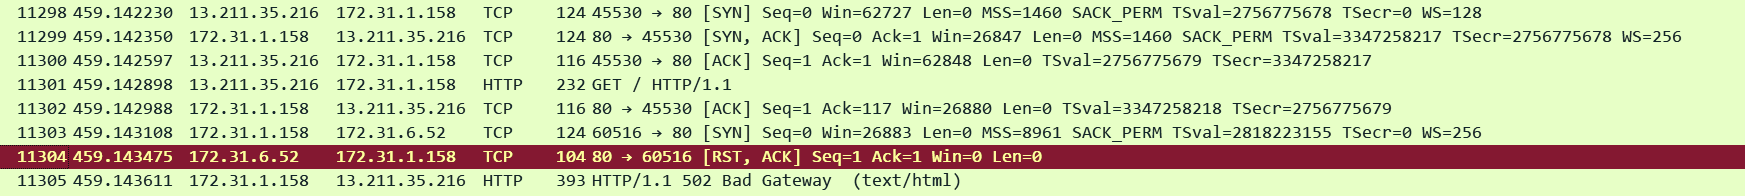
Corresponding ALB Access Log:
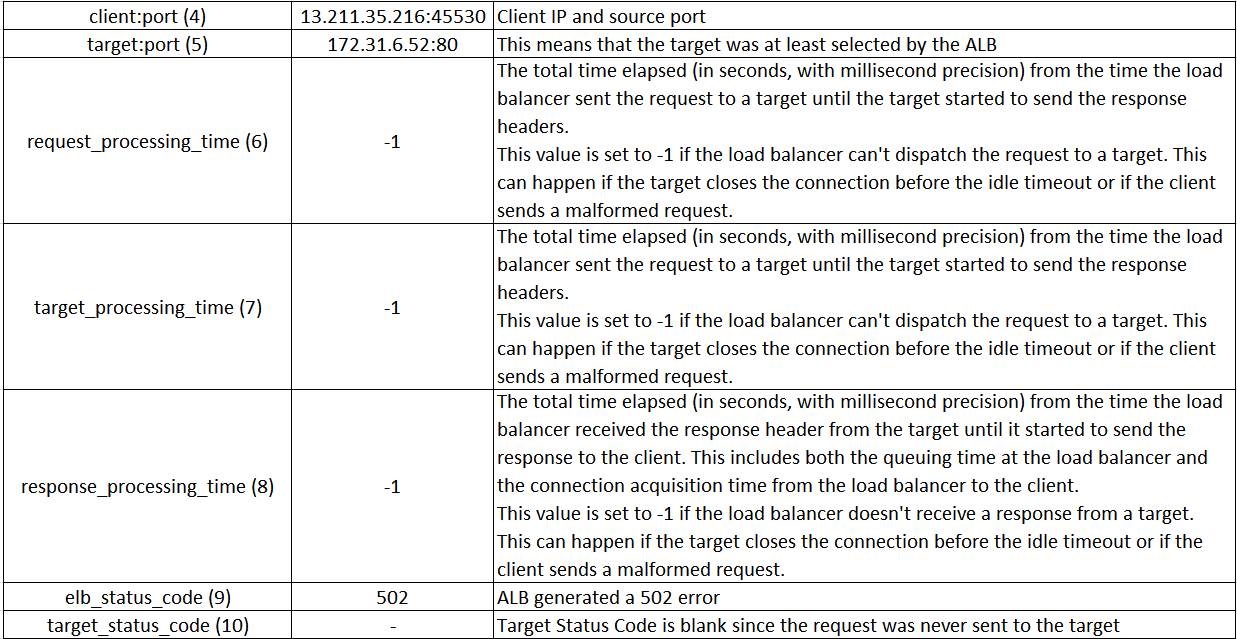
http 2025-12-11T16:42:57.298415Z app/alb-demo/1fa8b17e4c17e7c7 13.211.35.216:45530 172.31.6.52:80 -1 -1 -1 502 - 116 277 "GET http://alb-demo-1974023788.ap-southeast-2.elb.amazonaws.com:80/ HTTP/1.1" "curl/8.11.1" - - arn:aws:elasticloadbalancing:ap-southeast-2:592752082067:targetgroup/alb-demo/e1419229e570d841 "Root=1-693af491-5a6814f5635754d41bcc7a78" "-" "-" 0 2025-12-11T16:42:57.297000Z "forward" "-" "-" "172.31.6.52:80" "-" "-" "-" TID_58ffb8be714132458bbf068001512610 "-" "-" "-"
The most common reason is that the application port/socket is not in listening state on the target. Maybe the application crashed?? Use "ss -anp | grep <port number>" to check the status of the port.
Less commonly the application on the target could be generating a RST if it is overwhelmed with the current volume of connections/requests. Check OS TCP stack parameters / request worker settings on the web application.
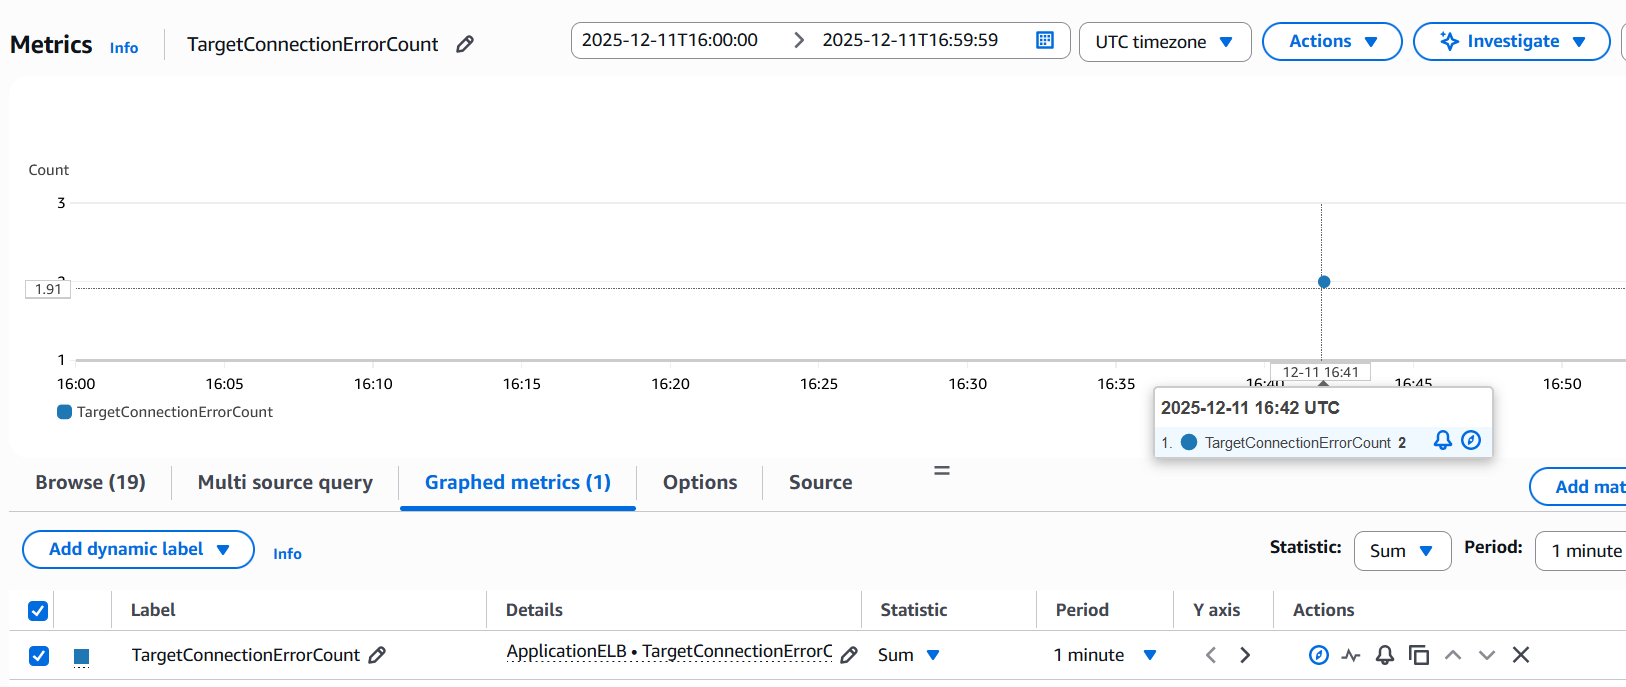
You can also use CloudWatch metric TargetConnectionErrorCount which increments when ALB is not able to establish a connection with the target:
2. The ALB received some other unexpected response from the target when trying to establish a TCP connection with the target such as "ICMP Destination unreachable (Host unreachable)":
This is similar to the previous one. Instead of RST the ALB receives some other unexpected response such as an ICMP error:
Make sure that the ALB subnets/ENIs can reach the backend targets and the specific target port. Check if routing from ALB to target is configured to go via some some firewall appliance or check Security features on the target itself like Iptables, OS Firewalls, AV software or any other endpoint security software.
3. The ALB established a TCP connection with the target and proxied an HTTP request to the target. While waiting for the response the ALB received a RST/FIN instead of a valid HTTP reply.
This means that the ALB was able to establish a connection and send the HTTP request to the target but it received a FIN or a RST instead of a valid HTTP reply.
The most common reason is that the HTTP KeepAlive timeout of the application running on the target is shorter than the idle timeout value of the load balancer. ALB supports HTTP Keep-Alive connections inherently and the default idle timeout of a server side KeepAlive connection on the ALB is 60 seconds (configurable 1 - 4000). More accurately the KeepAlive timeout configured on the target is shorter than the time it was supposed to take to process the request. Make sure to set the idle timeout on the ALB to accommodate for the longest running requests in your environment and also set the KeepAlive timeout on the targets slightly higher than the ALB timeout. Also keep in mind that while the application is busy processing a request, that time may not count towards the KeepAlive Timeout at all. KeepAlive timer only starts counting when all requests have been answered and there are no other outstanding requests on that connection and the application is now idle waiting for the next request on that connection.
Other reasons could be application issues where the application experienced some error and sent a FIN/RST. This is the key point - no matter what the reason is - the ALB receives a FIN/RST from the target instead of a valid response.
Corresponding ALB Access Log:
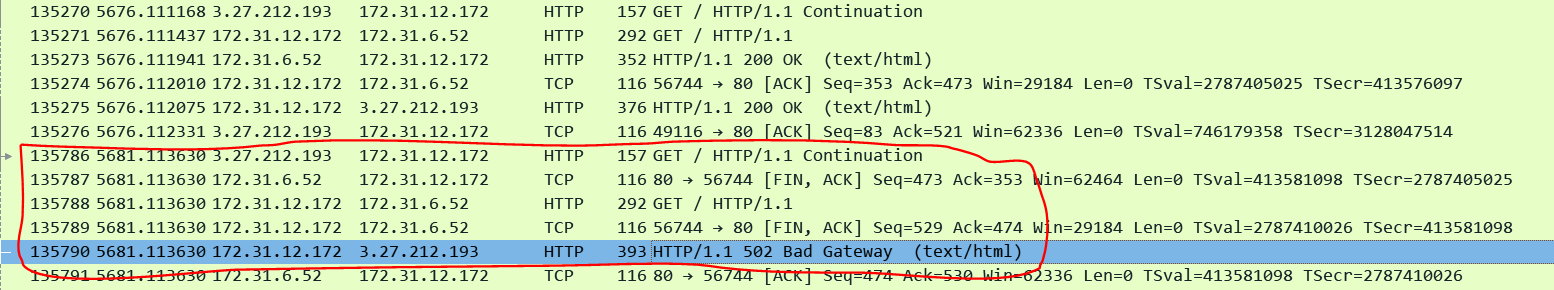
Finally there can be rare race conditions where the ALB starts sending a request on a KeepAlive connection just as the target starts to close the connection. For this lab the ALB IP was 172.31.12.172. In the below screenshot we can see that the previous request completed at packet 135274 (time is 5676.112). The Keep-Alive timeout on the target is set to 5 seconds. Exactly after 5 seconds the ALB receives another request in packet 135786 (time is 5681.113630). Now the next sequence of events are interesting. Exactly at the same timestamp the targets keepalive expires and it sends a FIN while the ALB passes the request to the target. This is a race condition and it results in the ALB sending a 502 to the client. Hence it is recommended to set the Keep-Alive timeout on the target slightly higher than the ALBs timeout.
4. The target response is malformed or contains HTTP headers that are not valid or the target response header exceeded 32 K for the entire response header:
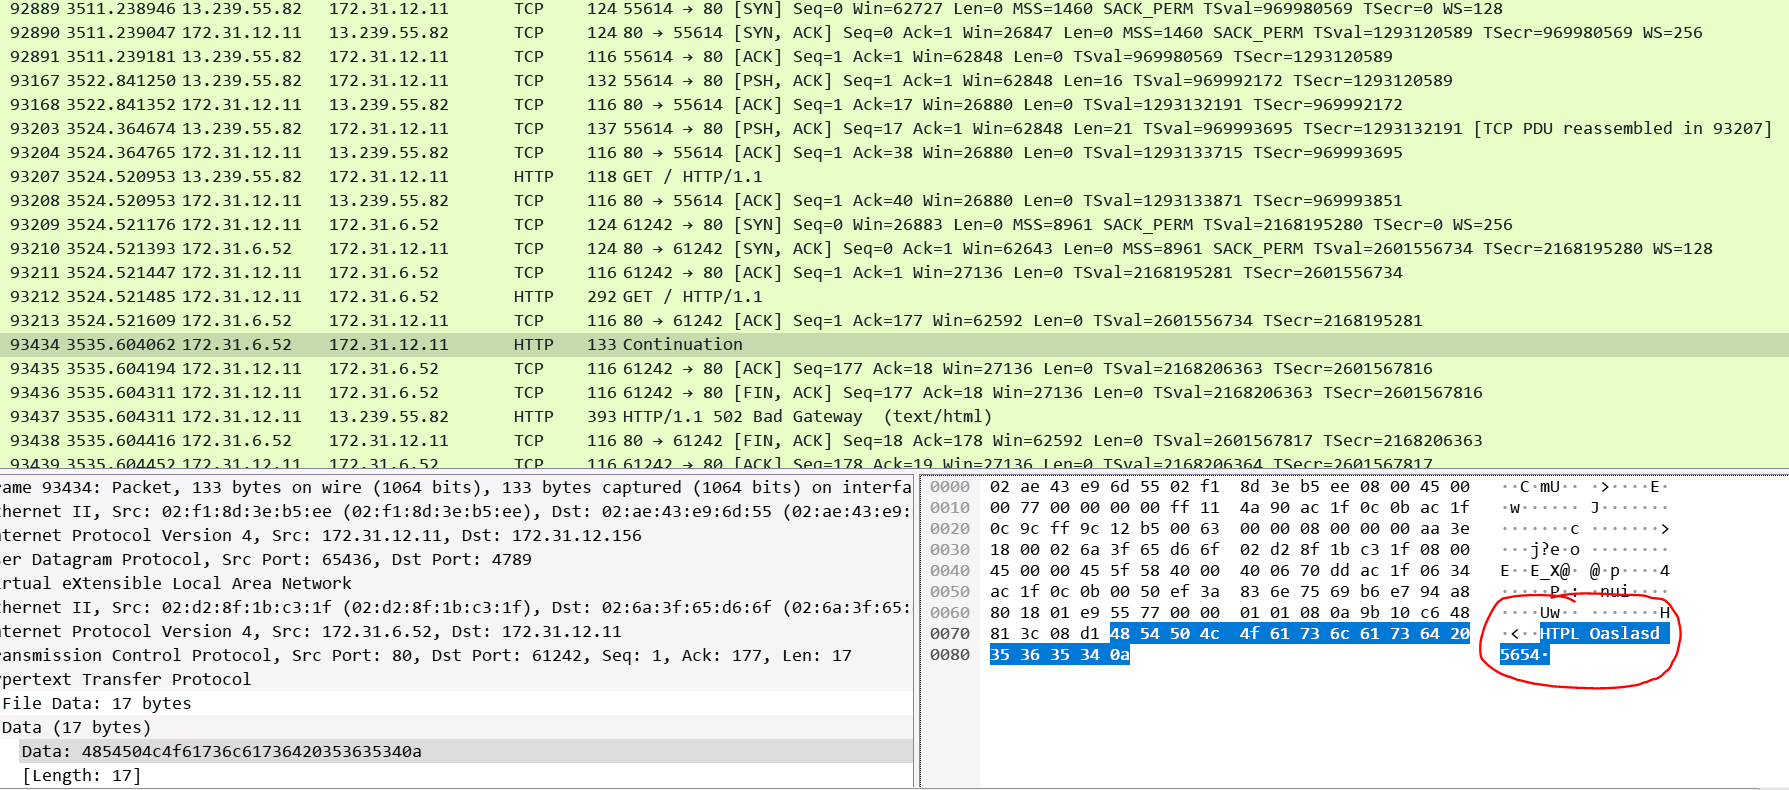
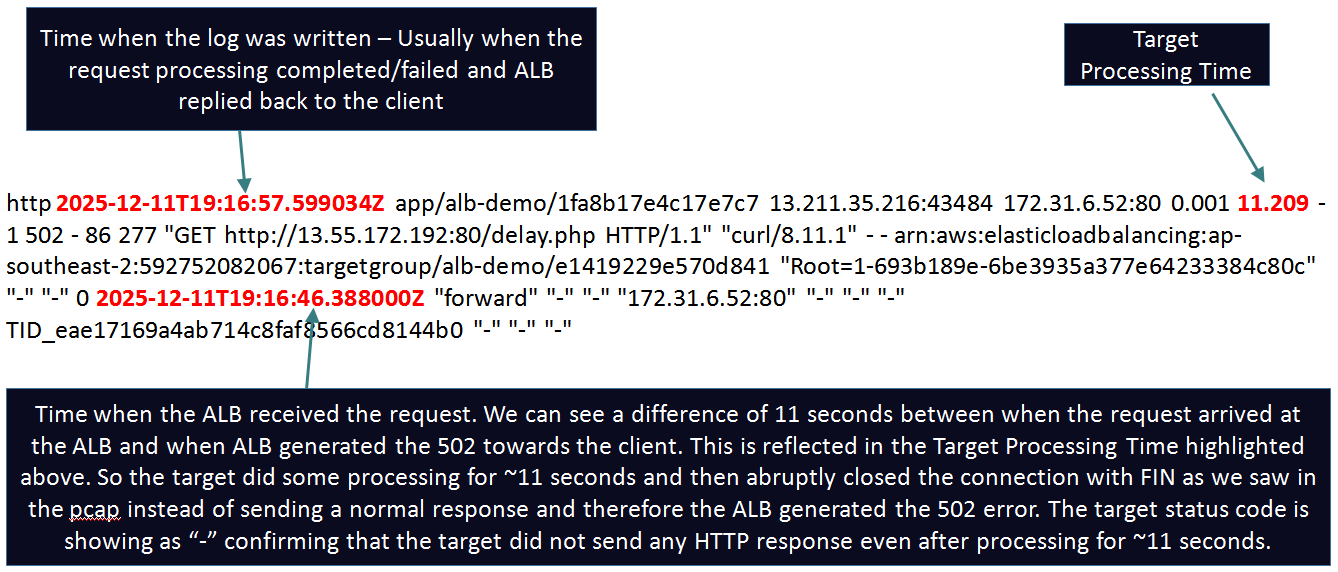
Corresponding Access Log: Similar to previous log where the target sent a FIN after starting to process the request. This time it replied with a garbage response as highlighted above in the pcap. Just by looking at the Access Log we can't tell how the target replied.
http 2025-12-12T06:19:41.701455Z app/alb-demo/1fa8b17e4c17e7c7 13.239.55.82:55614 172.31.6.52:80 0.000 11.083 -1 502 - 39 277 "GET http://52.63.142.248:80/ HTTP/1.1" "-" - - arn:aws:elasticloadbalancing:ap-southeast-2:592752082067:targetgroup/alb-demo/e1419229e570d841 "Root=1-693bb3f2-71b560c458bf732c4d88fcf8" "-" "-" 0 2025-12-12T06:19:28.938000Z "forward" "-" "-" "172.31.6.52:80" "-" "-" "-" TID_aedf5f6ebcb04c44bc925caec81449a4 "-" "-" "-"
It is not possible to take pcaps every time on ALB nodes or backend targets + these obviously don't help retrospectively. To diagnose such issues you can take help of the application logs on your targets. In every request ALB passes to the targets it inserts a unique Id in a header called: X-Amzn-Trace-Id. In the above Access Log you can see the value of this header getting logged: Root=1-693bb3f2-71b560c458bf732c4d88fcf8. You can log this field in your backend target application logs to easily correlate requests between the ALB Access Logs and your Application Logs. For example to log this field in Apache I modified the logging statement like so:
LogFormat "%h %l %u %t \"%r\" %>s %O \"%{Referer}i\" \"%{User-Agent}i\" %{X-Amzn-Trace-Id}i" combined
5. The ALB encountered an SSL handshake error when connecting to a target:
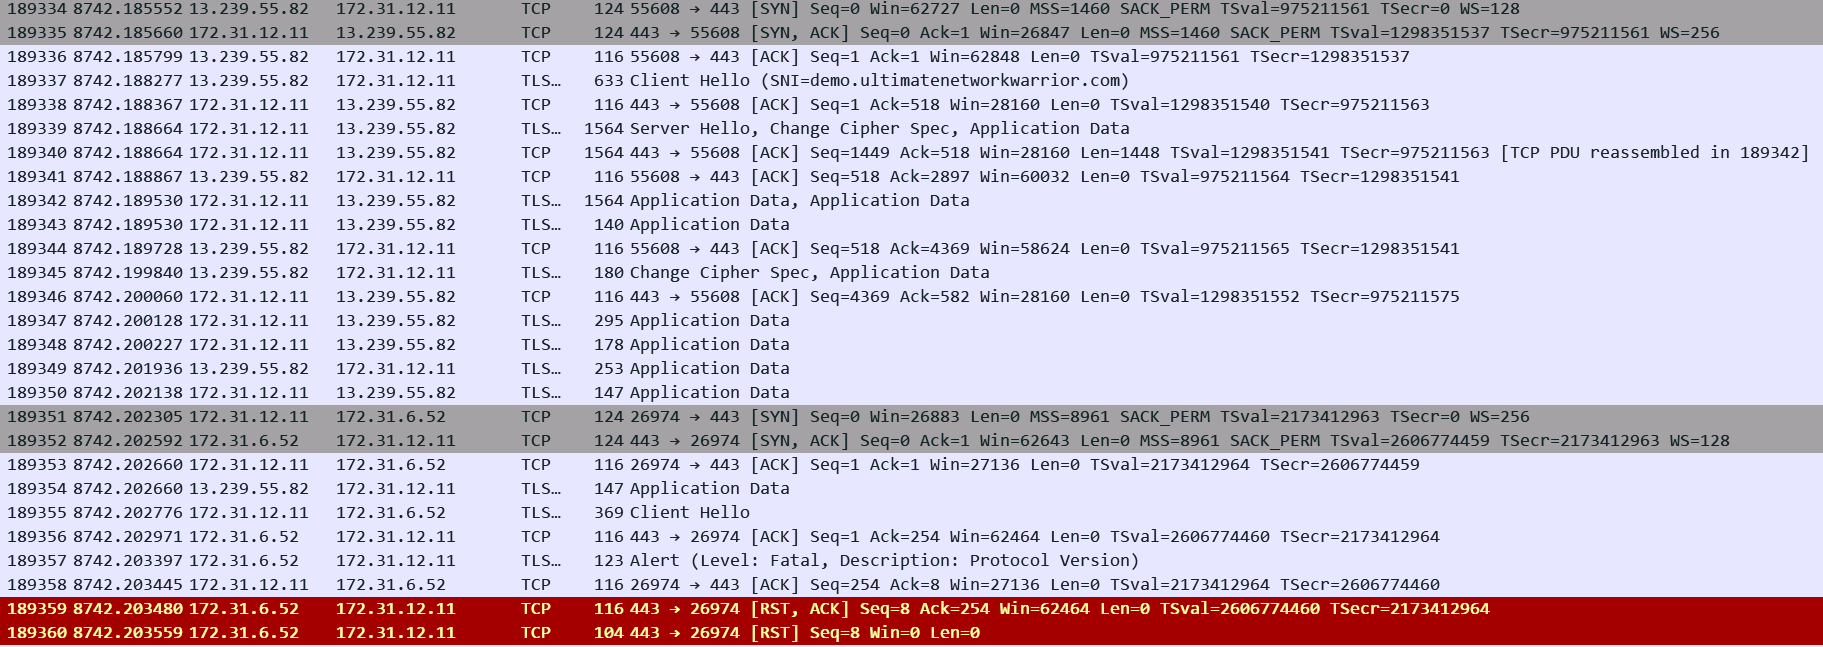
The most likely reason for this is Cipher mismatch between the ALB and the backend targets since the ALB otherwise does not care about trust or CN/SAN of the target certificate. You cannot control the exact Security Policy (TLS Version/Ciphers) that the ALB will use for the backend SSL handshake. The ALB documentation mentions which policy will be used on the backend side depending on what you choose for the policy for the front-end connection. The documentation then lists all the Ciphers and TLS versions supported in that particular policy. Make sure that the target supports a matching Version/Cipher. In the above example we can see target is sending RST as soon as it received Client Hello from the ALB indicating that this is a case of Cipher mismatch.
Corresponding Access Log: Its hard to tell what happened between the ALB and the target looking at the log:
h2 2025-12-12T07:46:28.345473Z app/alb-demo/1fa8b17e4c17e7c7 13.239.55.82:55608 172.31.6.52:443 -1 -1 -1 502 - 42 192 "GET https://demo.ultimatenetworkwarrior.com:443/ HTTP/2.0" "curl/8.11.1" TLS_AES_128_GCM_SHA256 TLSv1.3 arn:aws:elasticloadbalancing:ap-southeast-2:592752082067:targetgroup/alb-demo-https/fbf6f0e501cf0e4e "Root=1-693bc854-5f79074a0775e27e2223ebf3" "demo.ultimatenetworkwarrior.com" "arn:aws:acm:ap-southeast-2:592752082067:certificate/56609dae-79ce-4b2b-b54a-55a73dca1485" 0 2025-12-12T07:46:28.343000Z "forward" "-" "-" "172.31.6.52:443" "-" "-" "-" TID_9b58dfc3ffd1f642b5f5ce813d6f3f12 "-" "-" "-"
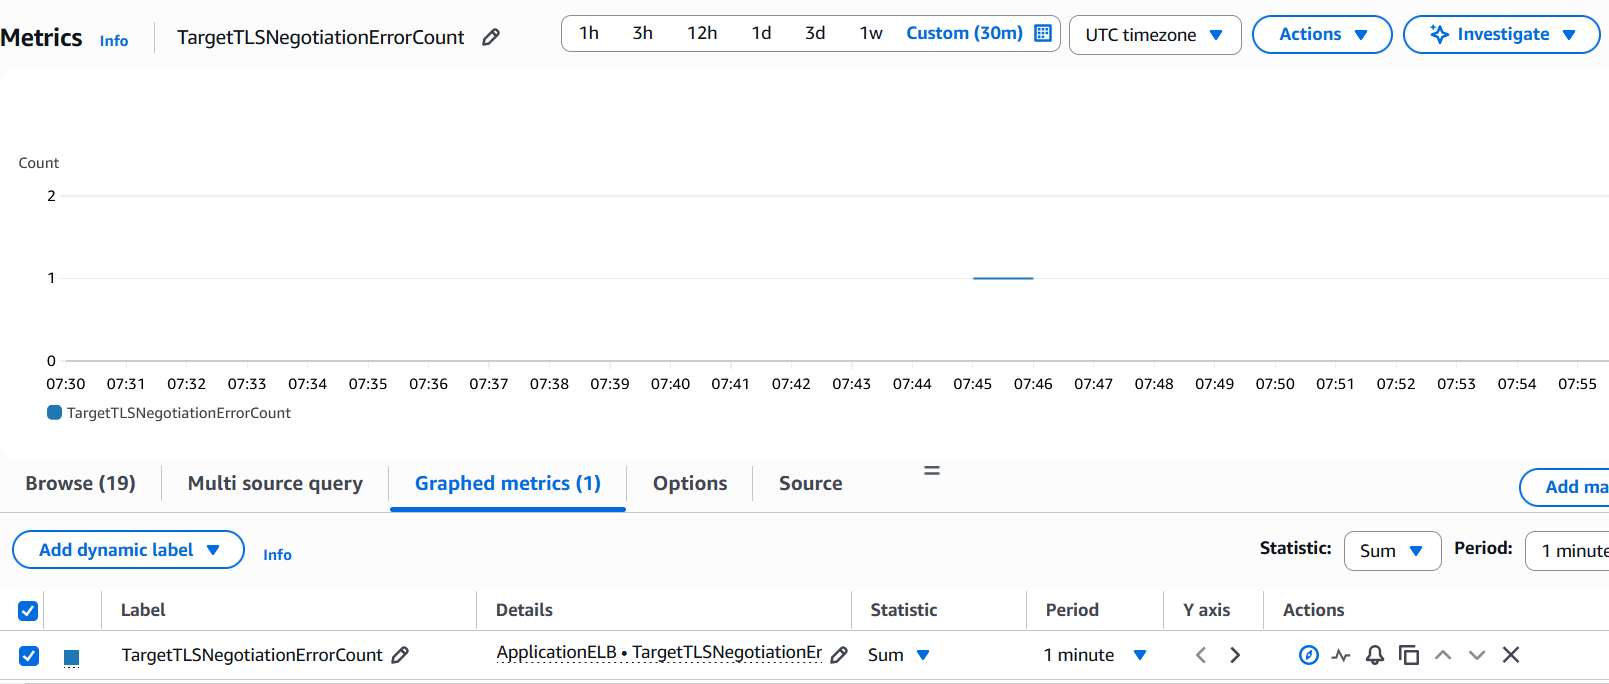
Use SSLDUMP/pcaps on the target to troubleshoot. You can also leverage CloudWatch metric: TargetTLSNegotiationErrorCount as it increments when ALB encounters SSL handshake issues with the targets.
6. The deregistration delay period elapsed for a request being handled by a target that was deregistered.
This happens when you deregister a target which is in the middle of serving a request and the Deregistration Delay times expires. This is one of the attributes of your Target Group. If the timer expires before the target replies the ALB aborts the request and sends a 502 error to the client. This issue is commonly seen when ASGs are used to manage your target fleet.
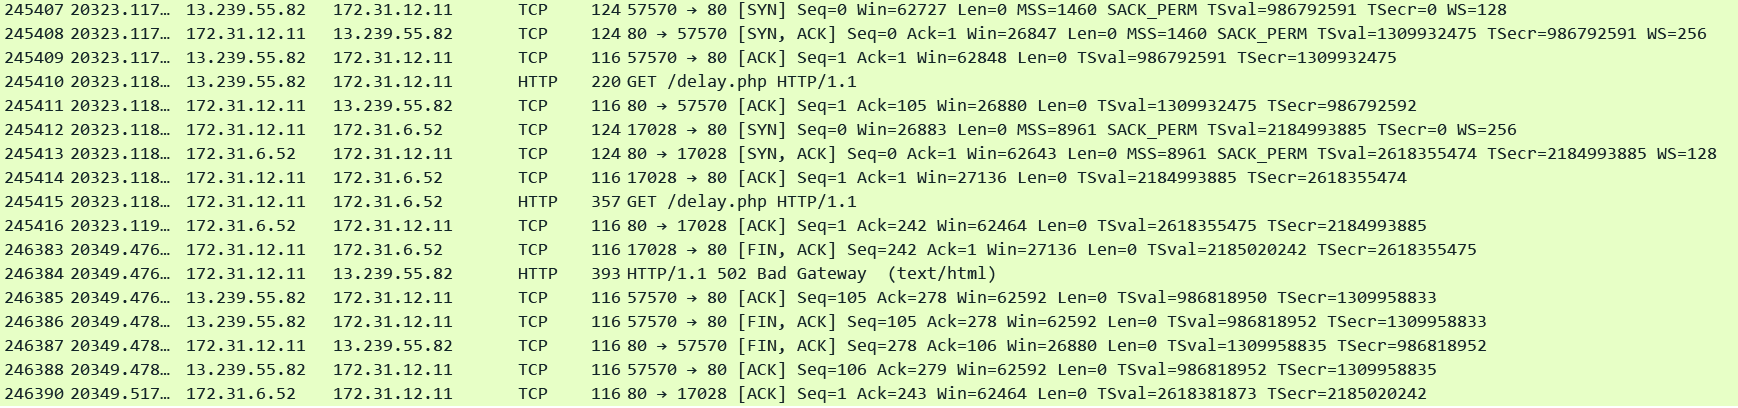
Subtle indications in the corresponding Access log below:
request_processing_time = .001 meaning ALB dispatched the request to the target
Some time elapsed between the arrival of request: 10:59:29.358 and when the log was generated 10:59:55.716 indicating the target was still processing the request
target_processing_time = -1 meaning the target did not respond at all. target_status_code is also set to "-" .
ALB is most likely the one who closed the request and generated the 502 error few seconds after dispatching the request to the target.
http 2025-12-12T10:59:55.716475Z app/alb-demo/1fa8b17e4c17e7c7 13.239.55.82:57570 172.31.6.52:80 0.001 -1 -1 502 - 104 277 "GET http://demo.ultimatenetworkwarrior.com:80/delay.php HTTP/1.1" "curl/8.11.1" - - arn:aws:elasticloadbalancing:ap-southeast-2:592752082067:targetgroup/alb-demo/e1419229e570d841 "Root=1-693bf591-7bbe21550445d86979e9a8d2" "-" "-" 0 2025-12-12T10:59:29.358000Z "forward" "-" "-" "172.31.6.52:80" "-" "-" "-" TID_163681a1d7e275408c1e2a4b2f2fe36d "-" "-" "-"
Simple solution for this issue is to increase the Deregistration Delay timer to be larger than your longest request processing times.
504 Errors (Cloudwatch: HTTPCode_ELB_504_Count) :
Also a very common error and the ALB generates it under very specific circumstances which are listed in the same AWS documentation. Here is an analysis on the most common reasons:
1. The ALB timed out while trying to establish a TCP connection with the target: The ALB expects a SYN ACK from the target within 10 seconds (non configurable). This is different from the 502 error where the ALB immediately gets a response that the target is not willing to establish the connection i.e a RST/FIN/ICMP error etc. In this case there is radio silence from the target side and after 10 seconds the ALB times out and generates a 504 error to the client. This will also show up under TargetConnectionErrorCount.
# curl -v http://alb-demo-1974023788.ap-southeast-2.elb.amazonaws.com
* Host alb-demo-1974023788.ap-southeast-2.elb.amazonaws.com:80 was resolved.
* IPv6: (none)
* IPv4: 52.63.142.248
* Trying 52.63.142.248:80...
* Connected to alb-demo-1974023788.ap-southeast-2.elb.amazonaws.com (52.63.142.248) port 80
* using HTTP/1.x
> GET / HTTP/1.1
> Host: alb-demo-1974023788.ap-southeast-2.elb.amazonaws.com
> User-Agent: curl/8.11.1
> Accept: */*
>
* Request completely sent off
< HTTP/1.1 504 Gateway Time-out <--- Response came from ALB
< Server: awselb/2.0
< Date: Fri, 12 Dec 2025 11:56:36 GMT
< Content-Type: text/html
< Content-Length: 132
< Connection: keep-alive
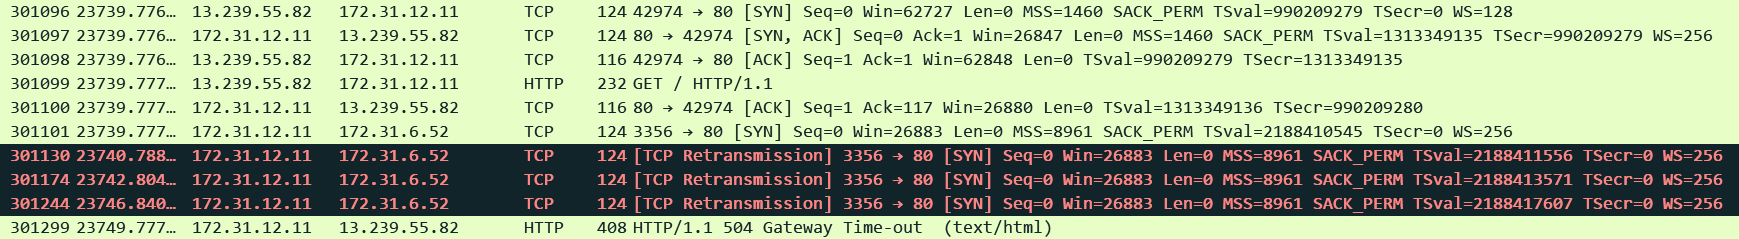
Corresponding Access Log: Exact 10 second difference between when the request arrived and when the ALB sent the error to the client and generated the log. All three processing times set to -1 indicating the request could not be dispatched to the target.
http 2025-12-12T11:56:36.046112Z app/alb-demo/1fa8b17e4c17e7c7 13.239.55.82:42974 172.31.6.52:80 -1 -1 -1 504 - 116 292 "GET http://alb-demo-1974023788.ap-southeast-2.elb.amazonaws.com:80/ HTTP/1.1" "curl/8.11.1" - - arn:aws:elasticloadbalancing:ap-southeast-2:592752082067:targetgroup/alb-demo/e1419229e570d841 "Root=1-693c02ea-0255ce967cdbe009768fbc2e" "-" "-" 0 2025-12-12T11:56:26.046000Z "forward" "-" "-" "172.31.6.52:80" "-" "-" "-" TID_1a741ab29cde2146ac30c20a6a9c5bee "-" "-" "-"
Most common reasons are Security Group/ACL/routing misconfigurations or some security feature like iptables/OS firewalls/custom firewalls/AV software/apparmor/SELinux/Endpoint Security etc on the target.
- Check Egress rules of the Security Group and ACLs applied to the ALB and the ALB subnets. They should allow traffic to all targets.
- Check Ingress rules of Security Group and ACL applied to targets and target subnets. They should allow traffic from all ALB subnets.
- Checking routing between the ALB subnets and the targets
- Check for any security features on the targets for example:
- Iptables: iptables -L
- Apparmor:
aa-status - SElinux:
getenforce - Firewall: ufw status
2. The ALB proxied an HTTP request to the target but the target did not respond before the idle timeout (default is 60 seconds) period elapsed:
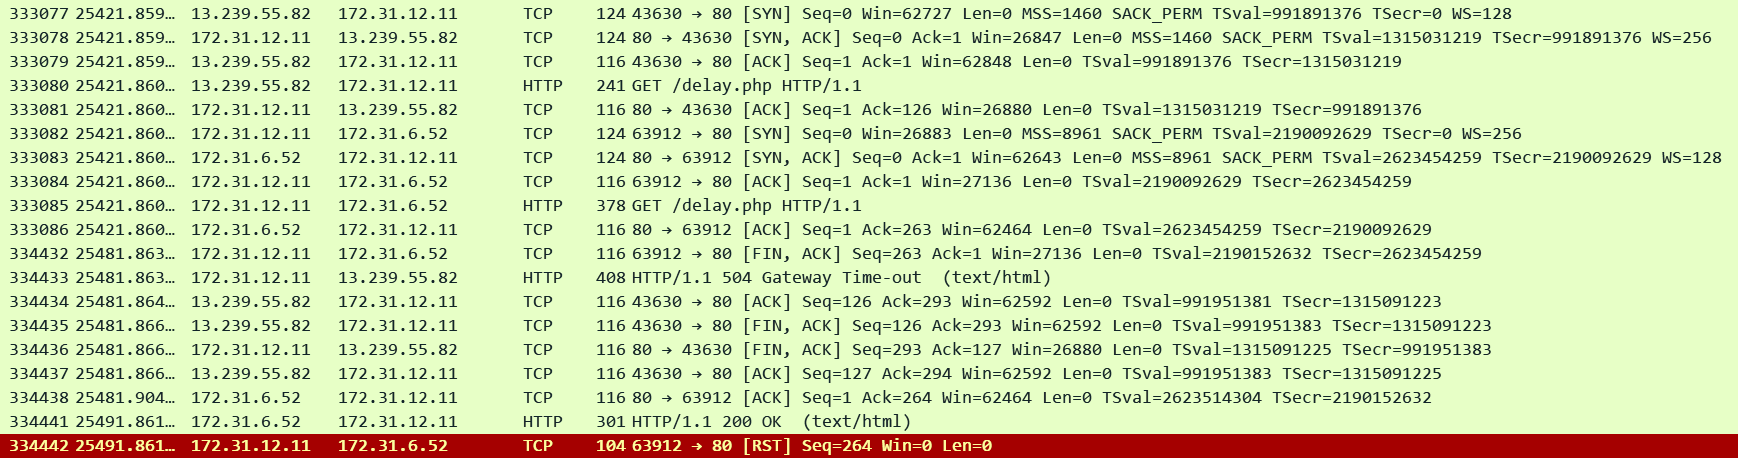
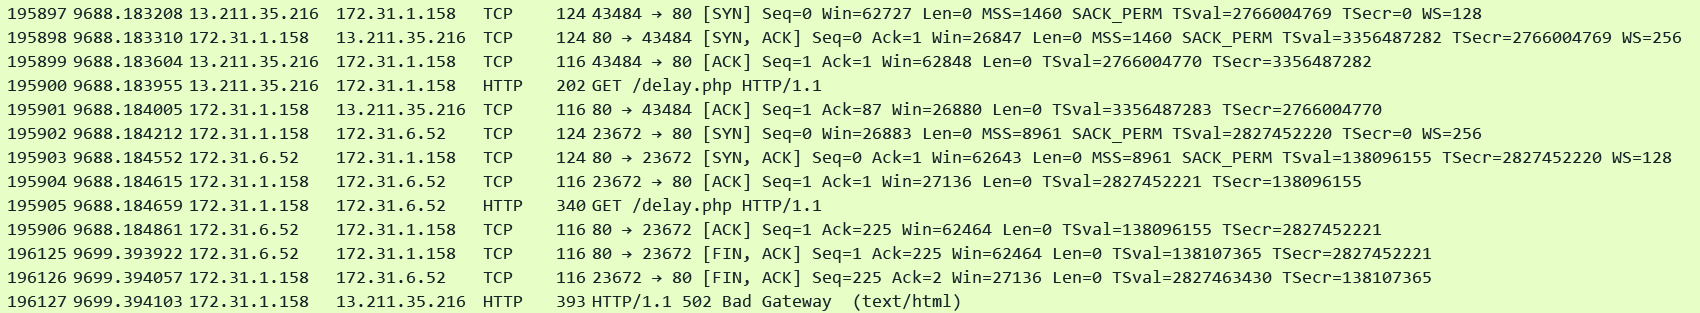
Check is it normal for the target to take more than 60 seconds to reply to some requests. Adjust the ALB idle timeout to accommodate for the longest running requests. In this pcap we can see that ALB timed out exactly after 60 seconds and sent a FIN to the target and a 504 to the client. Target finally replied after another 10 seconds (total 70 seconds) on the same socket but since ALB had already closed that socket it sent a RST to the target. Note that this may appear as a 200 in your target application logs!!
Corresponding Access Log: Our usual fields showing exact 60 seconds between both the timestamps. request_processing_time = .001 meaning ALB dispatched the request to the target and target_processing_time = -1 meaning that the target did not respond at all.
http 2025-12-12T12:25:28.147346Z app/alb-demo/1fa8b17e4c17e7c7 13.239.55.82:43630 172.31.6.52:80 0.001 -1 -1 504 - 125 292 "GET http://alb-demo-1974023788.ap-southeast-2.elb.amazonaws.com:80/delay.php HTTP/1.1" "curl/8.11.1" - - arn:aws:elasticloadbalancing:ap-southeast-2:592752082067:targetgroup/alb-demo/e1419229e570d841 "Root=1-693c097c-562c3d024a7d9aee7d99d8aa" "-" "-" 0 2025-12-12T12:24:28.143000Z "forward" "-" "-" "172.31.6.52:80" "-" "-" "-" TID_c1253952281bca4cb882b610f5c2220a "-" "-" "-"
3. The target returns a content-length header that is larger than the entity body. The ALB timed out waiting for the missing bytes.
This is similar to Point 2. In this case the ALB streams the received data to the client and waits for the remaining bytes. If the idle timeout expires then this can result in a 504 error or just a FIN from the ALB closing the connection. In my testing the ALB just closes the connection with a FIN. I could not see a 504.
Thanks for reading! Subscribe to stay in touch!
